WELCOME TO PV PERFORMANCE

PV installations are affected by decreasing yields in the first few days-weeks of operation.
This yield reduction occurs due to the light induced degradation (LID) in the PV modules.
In addition, the module performance can continue to decrease by up to 1% per year through various aging processes.

Unfortunately, these degradations are not the only causes for the reduction of the performance or PV systems or solar modules.

Further polarization effects in N-type solar cells/PV modules, as well as Potential Induced Degradation (PID)/High Voltage Stress (HVS), on P-type solar cells/PV modules can significantly reduce module performance and thus the system yields.

Since the PID/HVS degradation is a reversible effect, a regeneration of the affected PV modules is possible and thus an increase of the yield of the PV installation.

With the following tool you can calculate the possible increase in yield in your PV system, based on the measured string voltage and a few details about your PV system.

WHAT IS THE REAL PERFORMANCE POTENTIAL OF YOUR PV INSTALLATION?

Calculation method based on voltage degradation

Number of cells in the PV module

Qty.

The information can be found in the module data sheet (usually 60 or 72 cells per module)

Number of PV modules per string

Qty.

The information can be taken from the inverter design or planning documents.

Number of strings per inverter

Qty.

The information can be taken from the inverter design or planning documents.

Actual ambient temperature of the PV modules

°C

At the same time as measuring or determining the string / MPPT / inverter voltage

Actual String/ MPPT/ Inverter Voltage

Volt

Measured on a sunny, cloudless day (during the measurement), or reading on the WR display.

Voltage temperature coefficient of solar cells

%

The information can be found in the module data sheet (otherwise assume 0.4%)

Actual power generation during the past one year per MPPT/or inverter

kWh

Determined from the previous year's income or simulation. (Calculation only for an MPPT / inverter) *

Feed in tarif/ Electrical price

EUR

Price per kWh

Remaining remuneration period

Years

or calculated remaining lifetime of the PV system

*In case of different module assignments per MPPT, the calculation is necessary for each MPPT.

Result in V

The PV module mismatch factor is considered with 0,975%

Result in %

In the calculation it is assumed that the voltage will be regenerated to 100%

Result in

Non-binding sample calculation for possible earnings improvement. All statements without guarantee.

Result in

Non-binding sample calculation for possible earnings improvement. All statements without guarantee.

FURTHER REASONS FOR THE INSTALLATION OF A POWER BOOSTER

  • Avarage increase of the global radiation in Germany in the past 10 years in height of 3,44% compared to the time period 1991-2010 *
  • Conservative selection of degradation parameters in the yield simulation.
  • PV modules are tested according to IEC TS 62804-1:2015 /accelerated PID Stress Test and release as „PID FREE“ if the power loss after the Stress Test is less than 5%.
  • PID is a reversible Degradation and can be recovered easily with the Power Booster

*Database:

INCREASE OF POWER PRODUCTION PERFORMANCE ON HAND OF A CALCULATION EXAMPLE

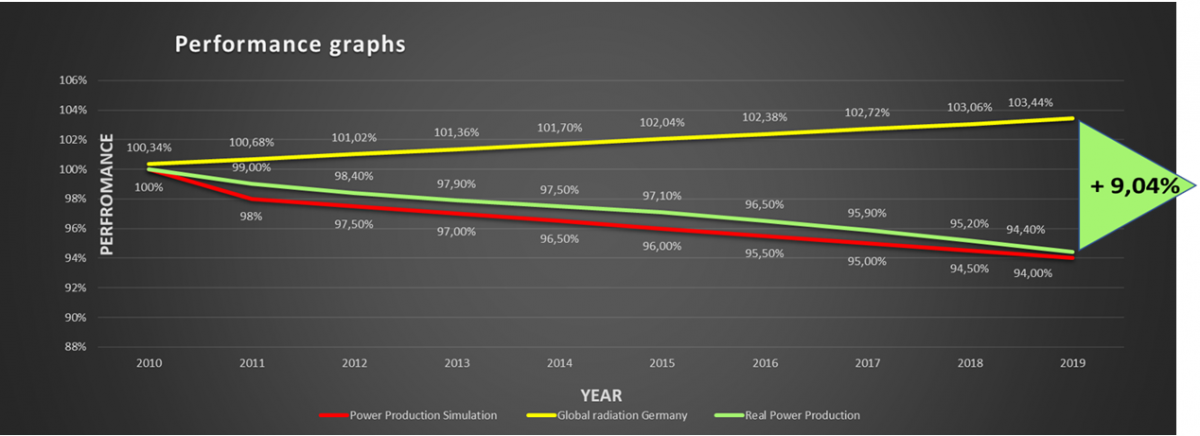
Calculation sample of a standard roof top PV installation with 28 kWp Power Installed in 2010 in Germany

Installation and Commissioning in 2010

Feed In Incentive: 39,14 ct/kWp
Power production for 2019 per kWp: 920kWh/kWp
Total Power Production in 2019: 28kWp*920kWh/kWp= 25.760 kWh

Possible improvement: 25.760 kWh * 9,04% = 2.329 kWh/Jahr*39,14 ct/kWp = 912 €/Year

PID/HVS PROTECTION CONCEPTS AND PID/HVS RECOVERY SOLUTIONS

Wechselrichter einer Photovoltaik Anlage

For String-Inverter

Products:

PVPB SI 10-1 SL
PVPB SI 20-1 SL
PVPB SI 30-3

One PV Power Booster fits for one String inverter.

In case of several string inverters positioned in one place, up to 4 string inverters can be connected to the DC output of the PV Power Booster with the PVPB-Extender.

Zentral Wechselrichter einer Photovoltaik Anlage

For Central-Inverter

Products:

PVPB CI 60-1
PVPB CI 60-3
PVPB CI 60-1 SL

The ROI of a Power Booster to an PV Installation with central inverters is usually very short.

One PVPB CI 60-3 Power Booster can be connected directly with up to 3 central inverters.

Photovoltaik Anlagen von oben gezeigt

Customized solutions

Products:

Power Booster with additional required components (e.g. time switches , PVPB-Extender…)

  • Solutions for inverter manufacturers (PID protection Integration in inverter, tests, case studies..)
  • Special PV installations (Floating Installation, complex Design)
  • Polarization regeneration in crystalline N-Typ PV Modules
  • Special Inverter requirements (Q@night, Riso control …)
  • Approvals, conformity declarations …

Contact data:

PV performance GmbH
Anna-Haag-Ring 49
75417 Mühlacker

Phone: +49 (0) 7041 9499 435
Fax: +49 (0) 7041 9499 436
E-Mail: info@pv-performance.com

Registered Office: Mühlacker
Managing Director: Dieter Schenker
District court of registration: Amtsgericht Mannheim
HRB 735148

VAT-Nr.: DE327745664